InvestorWaves

Latest stories

Sign up to our newsletter to get more data-driven visuals each day.

Line chart comparing CarMax combined quarterly unit sales and KMX stock price indexed to Q2 FY26. Unit sales rose to 114.7 by Q2 FY27 while the KMX stock-price index rose to 133.2 after a 59% EPS beat.
CarMax Isn't Dead Yet
Horizontal timeline chart showing four 2026 chipmaker AI-startup deals: NVIDIA buying Illumex, Kumo AI, and Hugging Face, and AMD buying World Labs, with deal values from roughly $75 million reported to $12.9 billion.
Chipmakers Buy the AI Stack
Horizontal bar chart comparing valuation-to-revenue multiples for Anthropic, OpenAI, Nvidia, Microsoft, Alphabet, Meta, and Amazon, showing Anthropic at 43.5x annualized Q2 2026 revenue.
The $2T AI Multiple
Line chart comparing NVIDIA buyback authorization increases from 2023 to 2026 with NVDA split-adjusted stock price. The latest point shows a $150 billion authorization and $235 billion remaining buyback capacity through fiscal 2028.
Nvidia Just Dropped a $150B Buyback
Line chart showing the CME FedWatch probability of a 25-basis-point Fed hike at the Oct. 27-28, 2026 FOMC meeting. The probability rose from 55.4% on Sept. 17 to a 70.9% peak on Sept. 23 and stood at 68.1% on Sept. 28.
Another Fed Hike Is Now the Base Case
Two-line chart comparing Cracker Barrel quarterly comparable-store sales growth from fiscal 2024 through fiscal 2026. Retail sales growth overtakes restaurant sales growth in the final two quarters and ends at positive 0.7%, while restaurant sales end at negative 2.1%.
Cracker Barrel's Gift Shop Just Beat the Dining Room
Historical line chart of the S&P 500 Shiller P/E from 1871 through September 2026. The current reading of 41.48 is highlighted in red near the December 1999 record of 44.19, with the long-run mean marked at 17.42.
Stocks Are Back in Dot-Com Territory
Chart for A Down-Trending Market
Chart for AI Has a Grid Backlog
AI Has a Grid Backlog
Chart for Reddit's Stock Pickers Are Having a Monster Year. Allegedly.
Reddit's Stock Pickers Are Having a Monster Year. Allegedly.
Ranked dumbbell chart showing launch price versus 2026 price for standard ad-free streaming plans. Disney+ rises from $6.99 to $21.49, Apple TV+ from $4.99 to $14.99, Netflix from $7.99 to $19.99, Peacock from $9.99 to $19.99, Hulu from $11.99 to $21.49, Paramount+ from $9.99 to $13.99, and HBO Max from $14.99 to $18.49.
Streaming's Ad-Free Price Climb
Bar chart showing the combined index weight of the two largest S&P 500 constituents from 1980 through 2026. The series dips near 5% in the 1990s, rises sharply after 2019, and reaches 15.7% in 2026 for Nvidia and Apple.
Two Stocks Are 16% Of The S&P 500
Line chart titled From 1% To 5%, showing the 30-year U.S. Treasury yield from 2020 to 2026. The chart labels a 0.99% low on March 9, 2020, and a 5.40% latest official close near 2026, with a note that the yield is at its highest level since 2004.
From 1% to 5%
Ranked horizontal bar chart titled Robots Need Muscles, showing the largest index weights in the Defiance Robotics Actuators ETF as of September 23, 2026. Fanuc is 7.95%, SMC is 7.76%, Nidec is 7.66%, RBC Bearings is 6.81%, SKF is 6.08%, Regal Rexnord is 5.36%, Timken is 4.94%, Moog is 4.59%, Shenzhen Inovance is 4.44%, Yaskawa is 4.35%, Airtac is 4.32%, and THK is 3.96%. A note says Defiance cites McKinsey estimating actuators at 40%-60% of a humanoid robot's bill of materials.
Robots Need Muscles
Chartr-style horizontal bar chart comparing Meta Muse and ChatGPT early mobile launch metrics. Muse reached 1.8 million U.S. and Canada iOS downloads in its first 12 days versus 1.3 million for ChatGPT. Muse reached 642,000 U.S. mobile daily active users by day 12 versus 231,000 for ChatGPT. A callout says Muse reached roughly 450,000 U.S. DAUs by day 10, while ChatGPT took 49 days.
Muse Beat ChatGPT's Mobile Launch
Chartr-style line chart showing the U.S. 30-year fixed mortgage rate over the last 10 years. Rates were around 3.48% in 2016, fell to a 2.65% low in early 2021, rose to a 7.79% high in 2023, and are shown back above 7% at 7.17% in September 2026. A dashed horizontal line marks the 7% level.
Mortgage Rates Are Back Above 7%
Line chart showing WTI crude futures rising from around $80 in mid-July 2026 to a mid-September peak near $106 before falling to about $90 on Sept. 22 amid reports of a possible Strait of Hormuz reopening path.
Oil's Hormuz Premium Is Leaking Out
Horizontal bar chart comparing FY2025 revenue, showing Kirkland Signature at $90 billion above Procter & Gamble, Coca-Cola, Nike, Starbucks, McDonald's, and lululemon.
Kirkland Is a $90B Brand
Line chart showing AMD market cap rising from about $2.3 billion in 2015 to about $1 trillion in 2026.
AMD Joins the $1T Club
Chartr-style log-scale scatterplot of notable AI models from 1950 to 2026 by estimated training compute in FLOP. Many background dots show Epoch AI records with known training compute, while frontier models such as GPT-4, Gemini 1.0 Ultra, Llama 3.1 405B, GPT-4.5, Grok 4, and Composer 2.5 are labeled near the top. A dashed 2026 segment notes that 2026 is partial and based on public estimates only.
Public AI Models Keep Climbing the Compute Curve
Chartr-style range chart showing on-demand cloud GPU rental prices by GPU model. B300 has a median price of $8.24 per GPU-hour, B200 $6.59, H100-NVL $4.95, H200 $4.42, H100-SXM $3.35, MI300X $3.22, H100 $2.99, and older or gaming-class GPUs lower. The chart shows min-to-max ranges, median dots, and offer counts.
AI Compute Has a Price Board
Chartr-style bar chart showing combined monthly trading volume for Kalshi and Polymarket from May through August 2026. May is $25.7 billion, June is $44.8 billion, July peaks at $53.0 billion, and August remains elevated at $45.3 billion. The chart notes that the World Cup ran June 11 to July 19 and August was still 77% above May.
Prediction Markets Had a Sports Summer
Bar chart of global gold-backed ETF fund flows in 2026. February was plus $5.3 billion, March was minus $12.0 billion, April was plus $6.6 billion, May was minus $2.0 billion, June was minus $8.9 billion, July was plus $3.0 billion, and August was plus $18.0 billion. A callout notes that August inflows helped push holdings to a record 4,189 tonnes.
Gold ETF Holdings Hit a Record
Ranked dot plot showing July 2026 year-over-year semiconductor sales growth of 171.3% in the Americas, 134.9% in Asia Pacific and other markets, 123.6% in China, 85.2% in Europe, and 50.8% in Japan.
The Chip Boom Is Global
Line chart of TSMC monthly revenue in 2026 rising from NT$401.3 billion in January to a record NT$514.8 billion in August, up 53.3% year over year.
TSMC's AI Boom Just Hit a New High
Chart for Data Centers Are Becoming Power Hungry
Data Centers Are Becoming Power Hungry
Chart for IPO Money is Back
IPO Money is Back
Chart for Texas Tapped The Brakes on Data Centers
Texas Tapped The Brakes on Data Centers
Chart for Business AI Adoption is Still Uneven
Business AI Adoption is Still Uneven
Chart for The AI Boom Hit The Factory Floor
The AI Boom Hit The Factory Floor
Chart for Amazon's AI Buildout Has a Cash Cost
Amazon's AI Buildout Has a Cash Cost
Chart for Korea's Export Boom is an AI Chip Story
Korea's Export Boom is an AI Chip Story
Chart for Options Trading Keeps Setting Records
Options Trading Keeps Setting Records
Chart for Nvidia Is Locking In The AI Buildout
Nvidia Is Locking In The AI Buildout
Chart for Data Centers Are Carrying Construction
Data Centers Are Carrying Construction
Chart for Eli Lilly is a GLP-1 Company Now
Eli Lilly is a GLP-1 Company Now
Chart for AI Networking TAM Unlock: $15B to $154B
AI Networking TAM Unlock: $15B to $154B
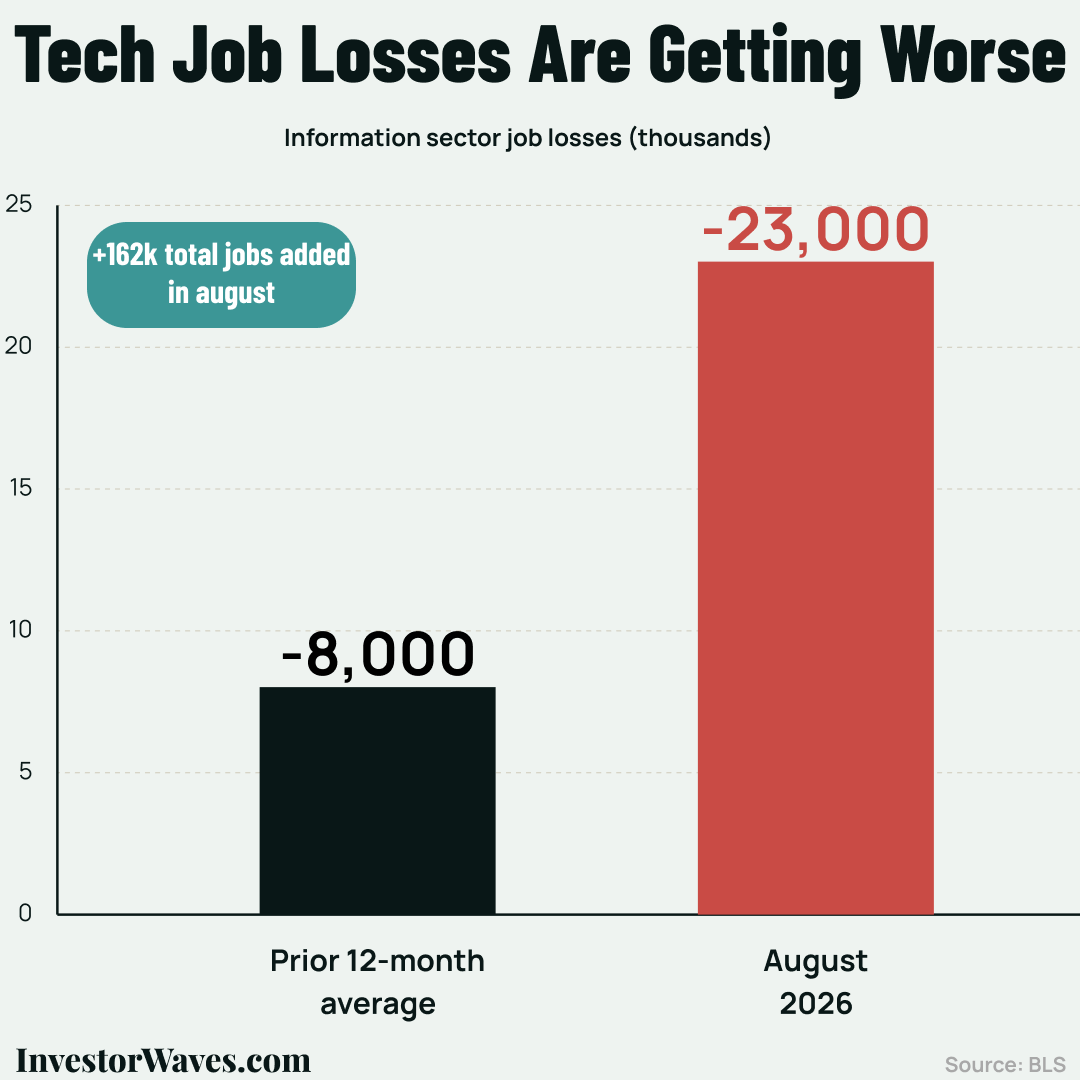
Chart showing information sector job losses worsening from an average of 8,000 per month over the prior 12 months to 23,000 in August 2026.
Tech job losses are getting worse
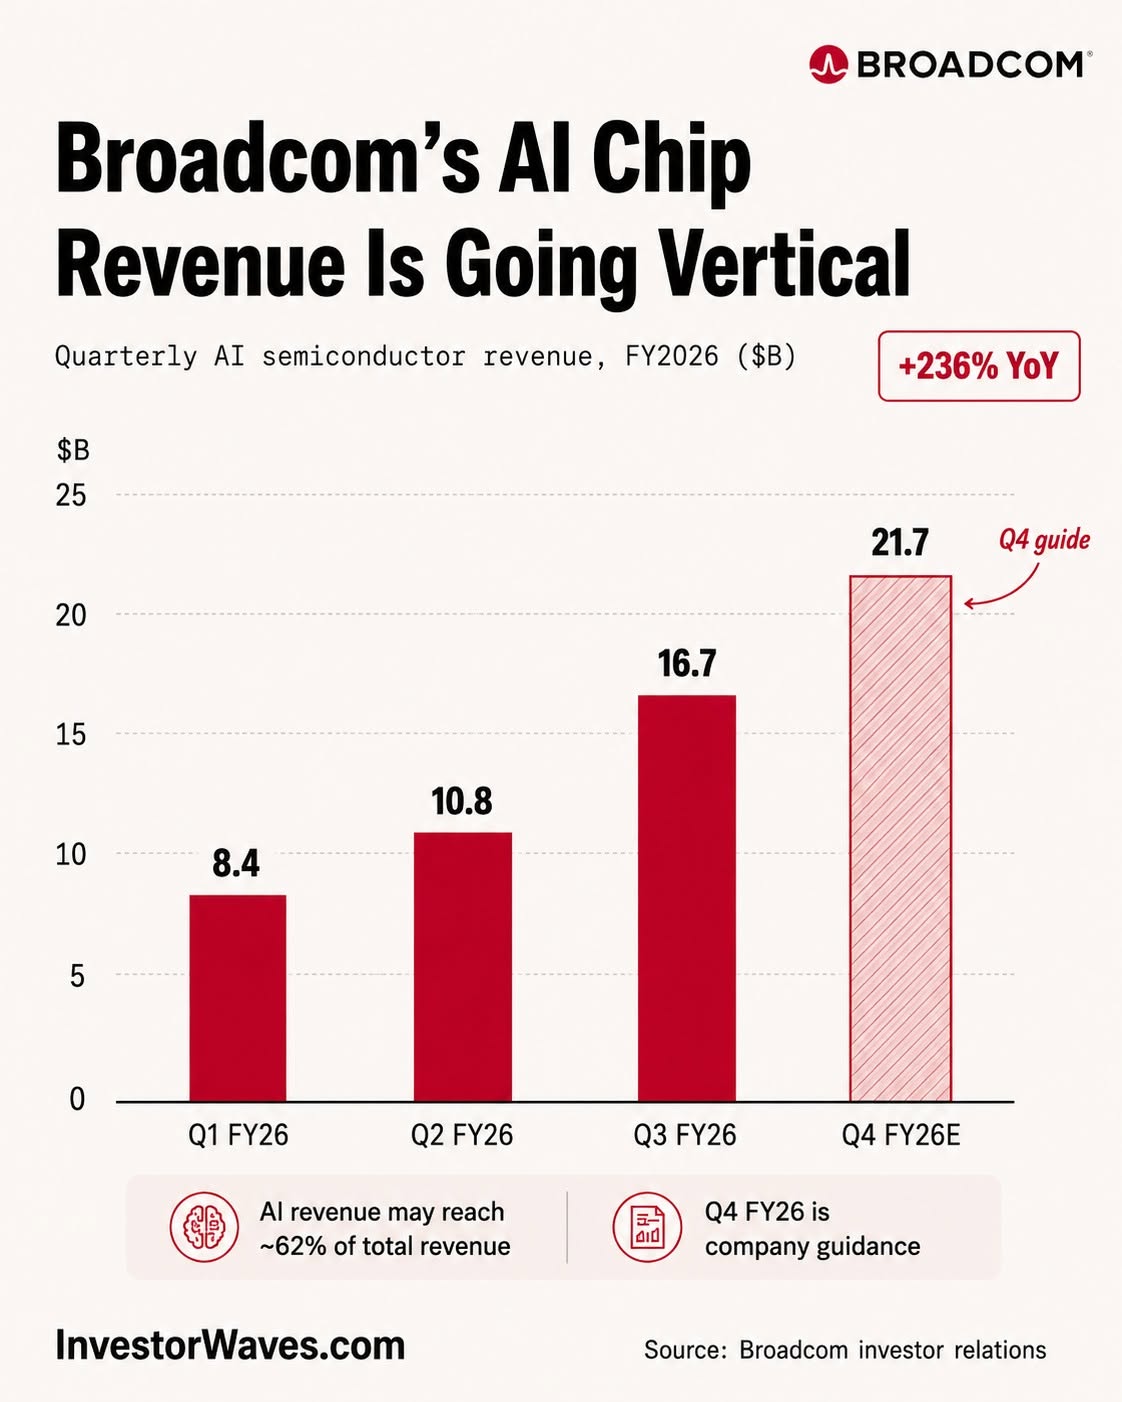
Chart showing Broadcom's quarterly AI semiconductor revenue rising from $8.4B in Q1 FY2026 to $21.7B guided in Q4 FY2026.
Broadcom's AI chip revenue is going vertical
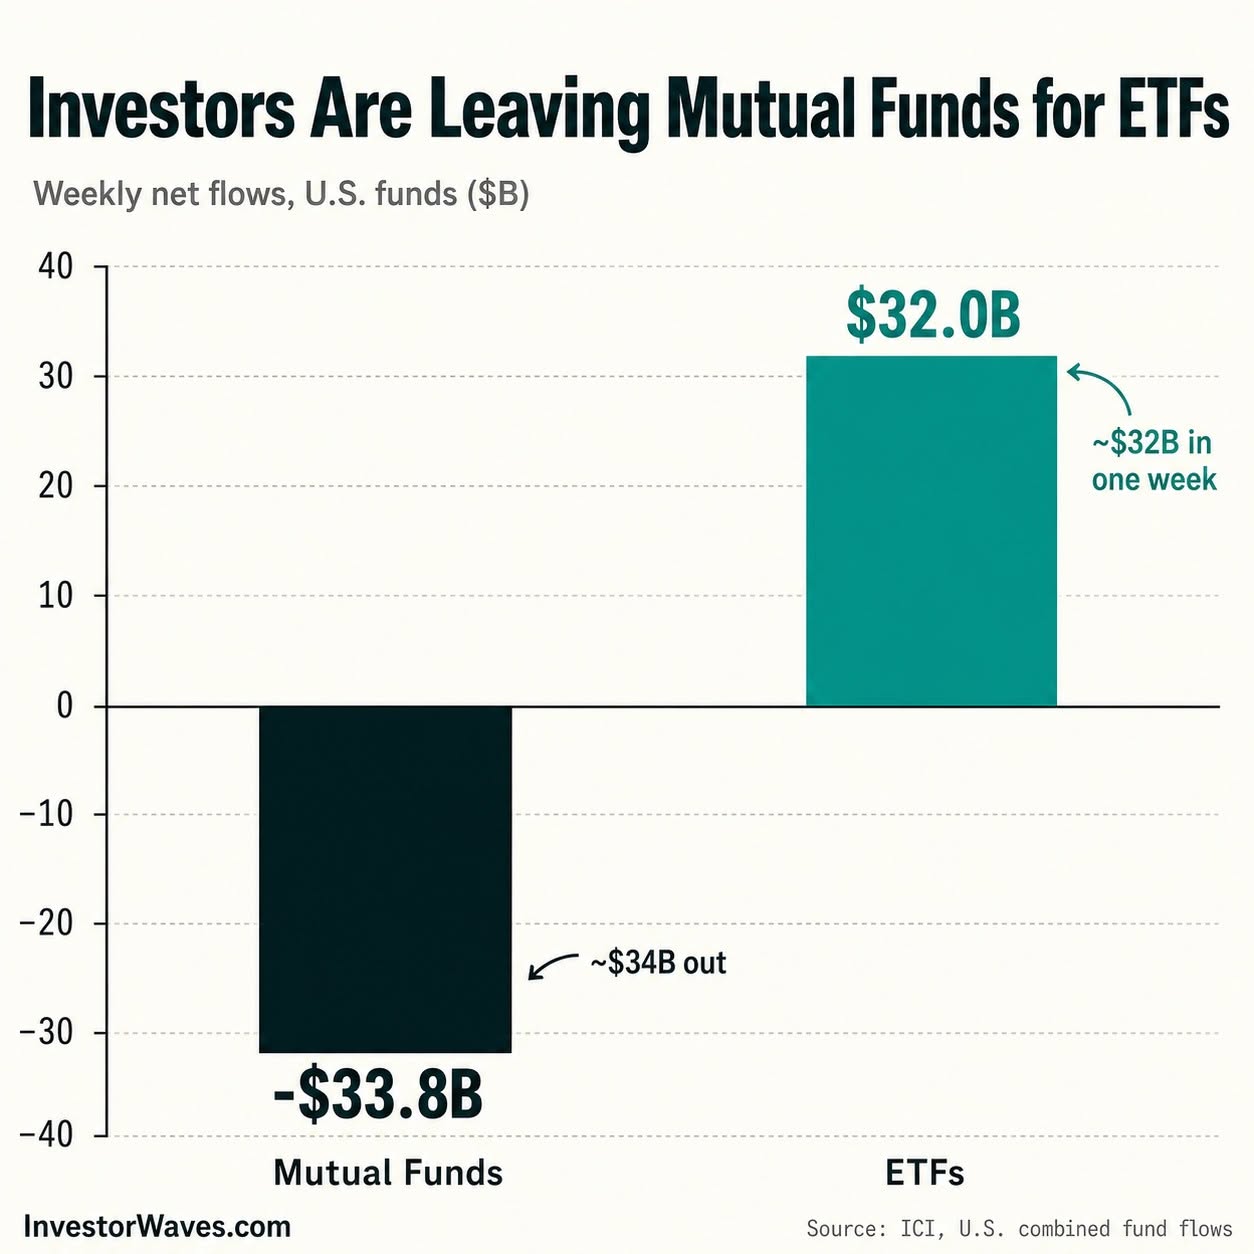
Chart showing U.S. mutual funds with $33.8B of net outflows and ETFs with $32.0B of net inflows.
Investors are leaving mutual funds for ETFs